
Please note that this post is about ASP.NET non-core up to .NET Framework 4.8.x. It may also work for the newer .NET but I haven’t tried or tested it. To make this work you need your ASP.NET application to be served from a Windows machine where you also have access to the desktop, via RDP for example.
We can’t always have nice things
Sometimes there is no ApplicationInsights, NewRelic, Grafana or Prometheus. Even without something fancy in place, you want some insights into your running application. Luckily you can get pretty good insight with Windows onboard tools though they have their shortcomings. For small projects, this will probably suffice entirely and save you a headache from choosing a roll-your-own monitoring stack with the bonus that it’s free.
How to be a cheapskate and still see stuff
- Go to the Run dialogue (
WindowsKey + ror right-click on the Windows icon in the taskbar and choose Run) - Type in mmc.exe and hit enter
- Click on File -> Add/Remove Snap-In and move Performance Monitor from the left box to the right box
- Click on Performance -> Monitoring Tools -> Performance Monitor on the left tree menu
This should bring up an empty graph - You can add metrics by clicking on the green plus sign and remove them by clicking on the red munis sign on top of the graph
- There are a ton of available counters. Most useful for a web application (IMHO):
- Processor – % Processor Time,
- ASP.NET – Requests Queued,
- ASP.NET Applications – Requests/Sec and
- ASP.NET Applications – Errors Total
- Find descriptions and more useful counters here:
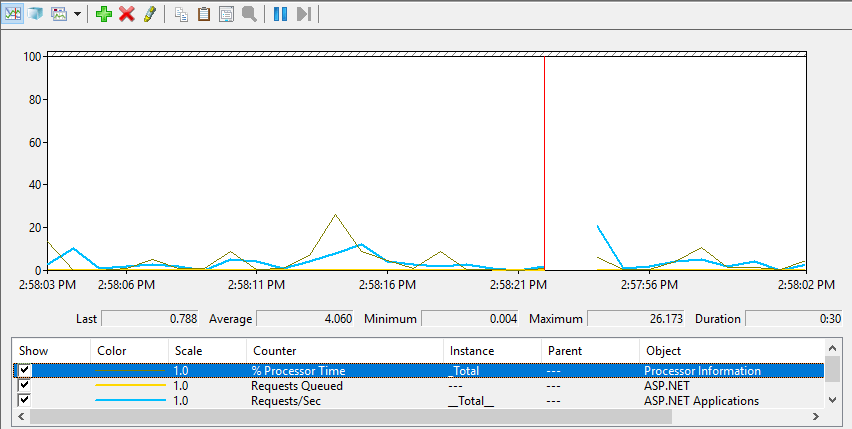
- You need to adapt the scale if you can’t see anything, also changing the colors helps. The graphing is pretty rudimentary in general.
If you did a reasonably good job you should see something like this:
Saving the view for later reuse
If you close Perfmon now, all your settings will be gone if you open it again later. To save all of your configuration click on File -> Save As… in the Management console and place the file wherever you want. If you double-click the file, your monitors are restored.
If you opened Perfmon directly and not via the management console you will not be able to save your settings so make sure you open it correctly before investing time to build a super nice-looking graph :).
Foto von Isaac Smith auf Unsplash